Park Managers, What's Going on in Ohio's State Parks?
To gain insight into the impact outdoor recreation has on Ohio's state parks, my research team looked to park managers for information about trends in human activity, park degradation, and the relationship between them. As park managers are trusted with operating and maintaining Ohio's state parks, we wished to learn about what they observe firsthand, from recurring pollution issues to visitor response to prevention strategies. We also inquire about their personal perspectives on conservation and sustainability for insight into how park managers think about their role. In the final question of the survey, managers are given the chance to share any ideas or visions they have for new conservation efforts or areas needing improvement, informed by the implications of outdoor recreation they see on a day-to-day basis.
A 13-question digital survey, with a mixture of collection styles including open-ended response, rating scales, and "select all that apply" checkboxes, was distributed to 59 Ohio state park managers. We received a total of 26 responses from this sampling population with the respondents representing 39 of 76 state parks in Ohio.
Survey Questions & Responses
Several individuals from the sample experienced issues accessing the survey, causing my team to have our responses recorded in two separate platforms (the questions remained the same between them). The following document combines the data received from both surveys.
Links to original survey platforms:
Data Visualization
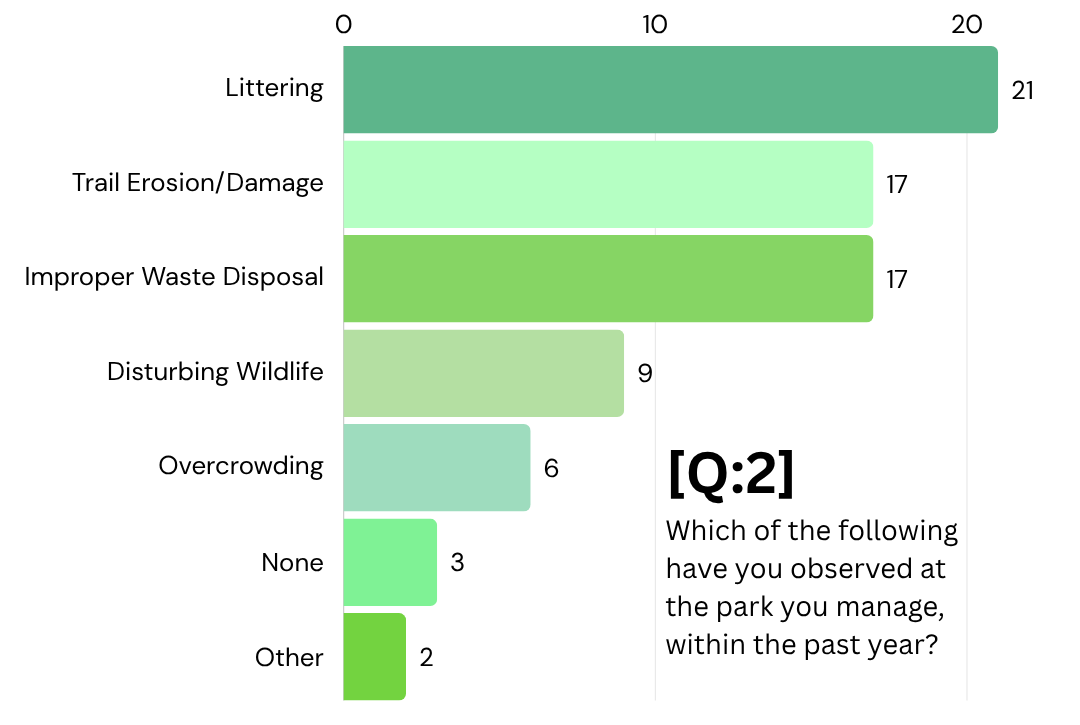
The following chart visualizes data from question two of our survey, indicating that littering was the most observed implication of human activity in state parks. Improper disposal of waste tied for the second most observed implications, which could go hand-in-hand with littering behaviors.
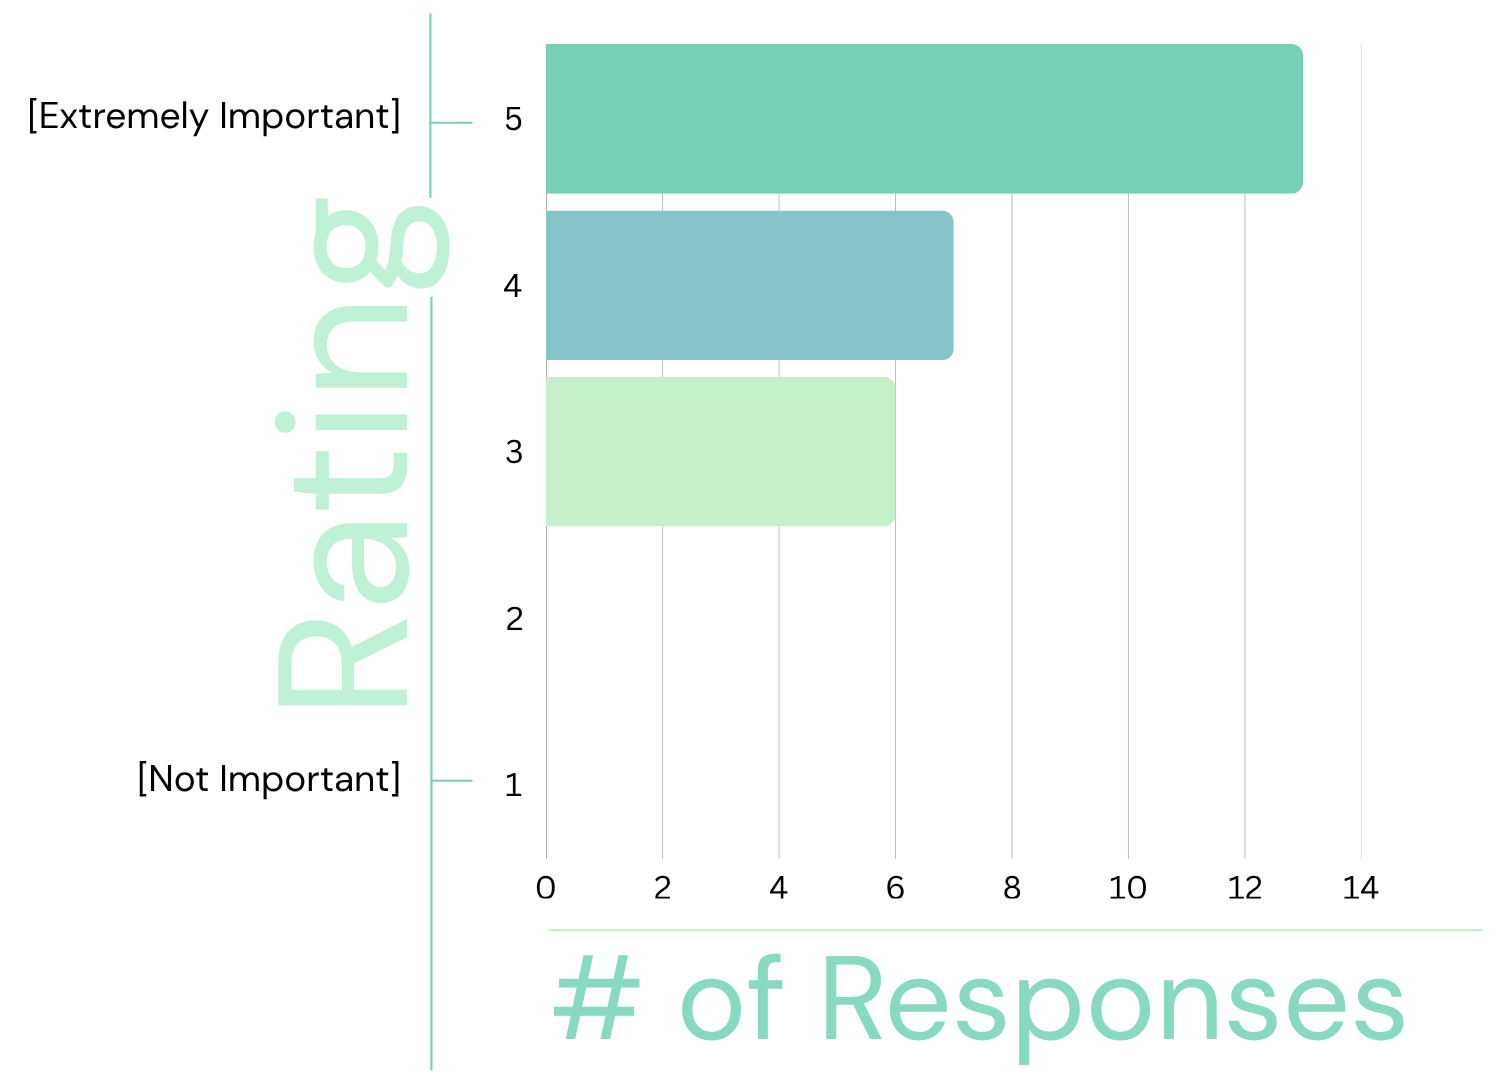
When asked to rank the importance of engaging in conservation and sustainability efforts from a personal standpoint, none of the respondents selected rank 1 or 2, and a majority selected rank 5, indicating that conservation efforts were extremely important to them (13 responses).
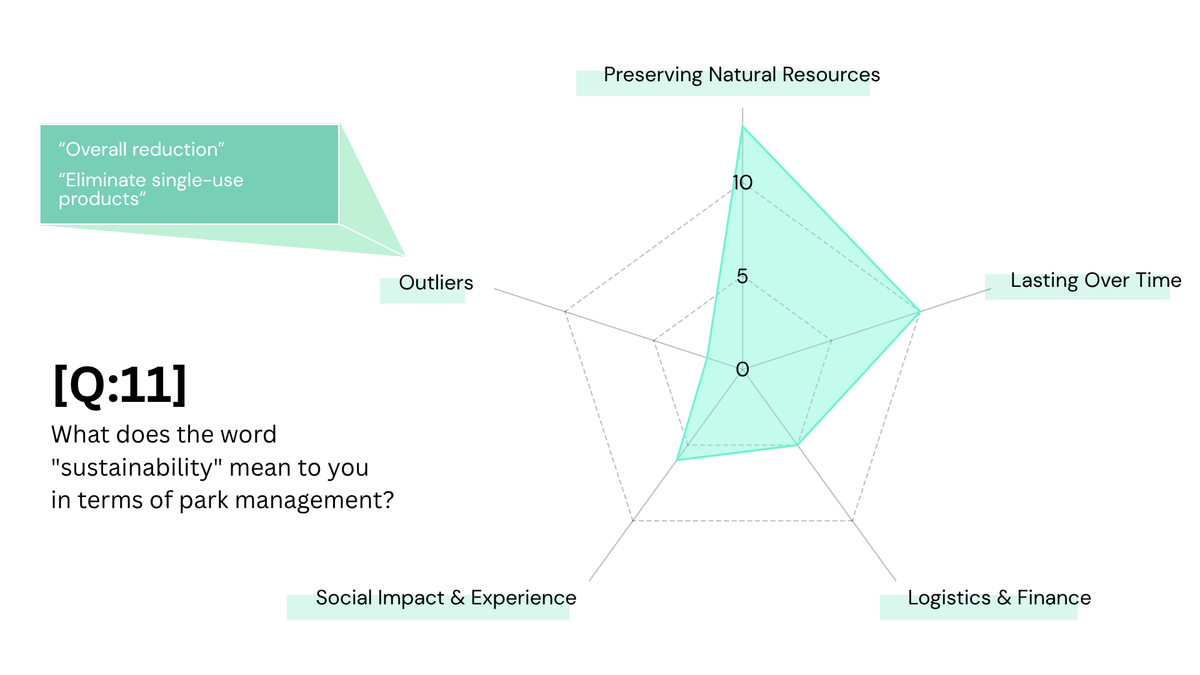
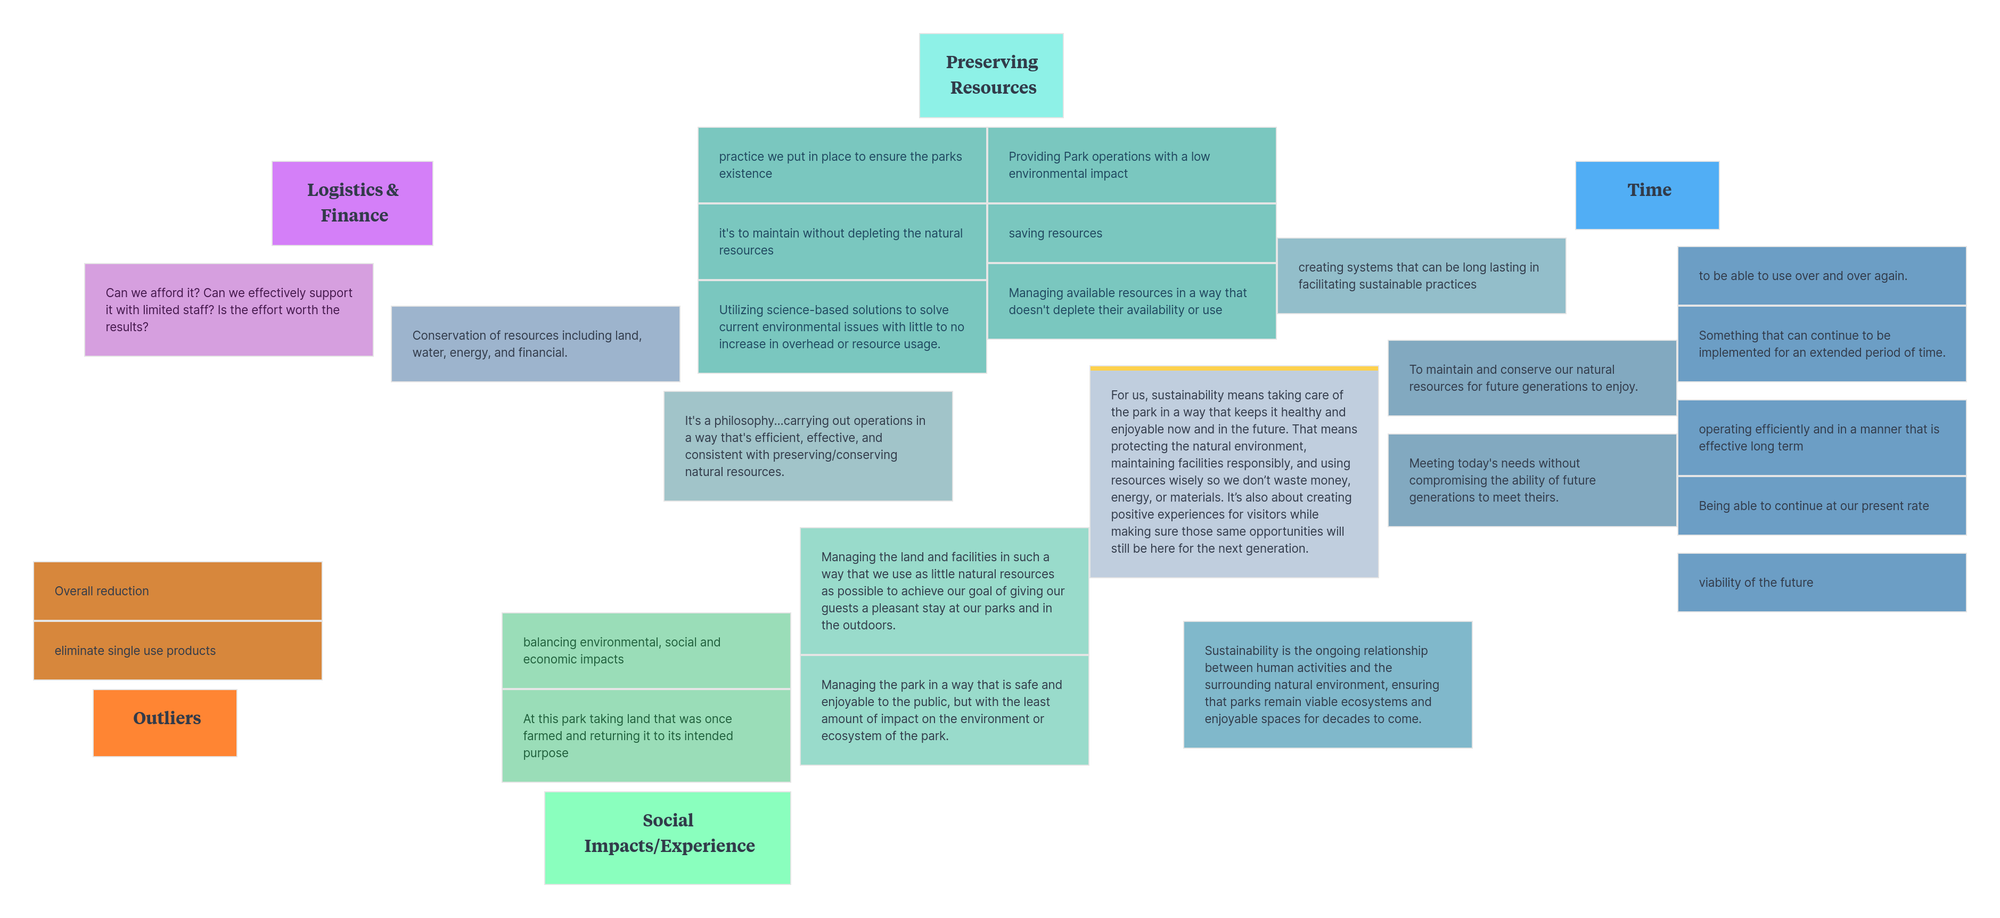
The following chart shows the process for sorting responses to question 11 an open-ended collection method that asks what the term, "sustainability" means to them personally. These we organized into categories including: Logistics & Finance, Social Impacts/Experience, Preserving Resources, Time, and Outliers. The color variations between categories displays each response's relevancy to the category. The response highlighted with a yellow banner is relevant to all categories.

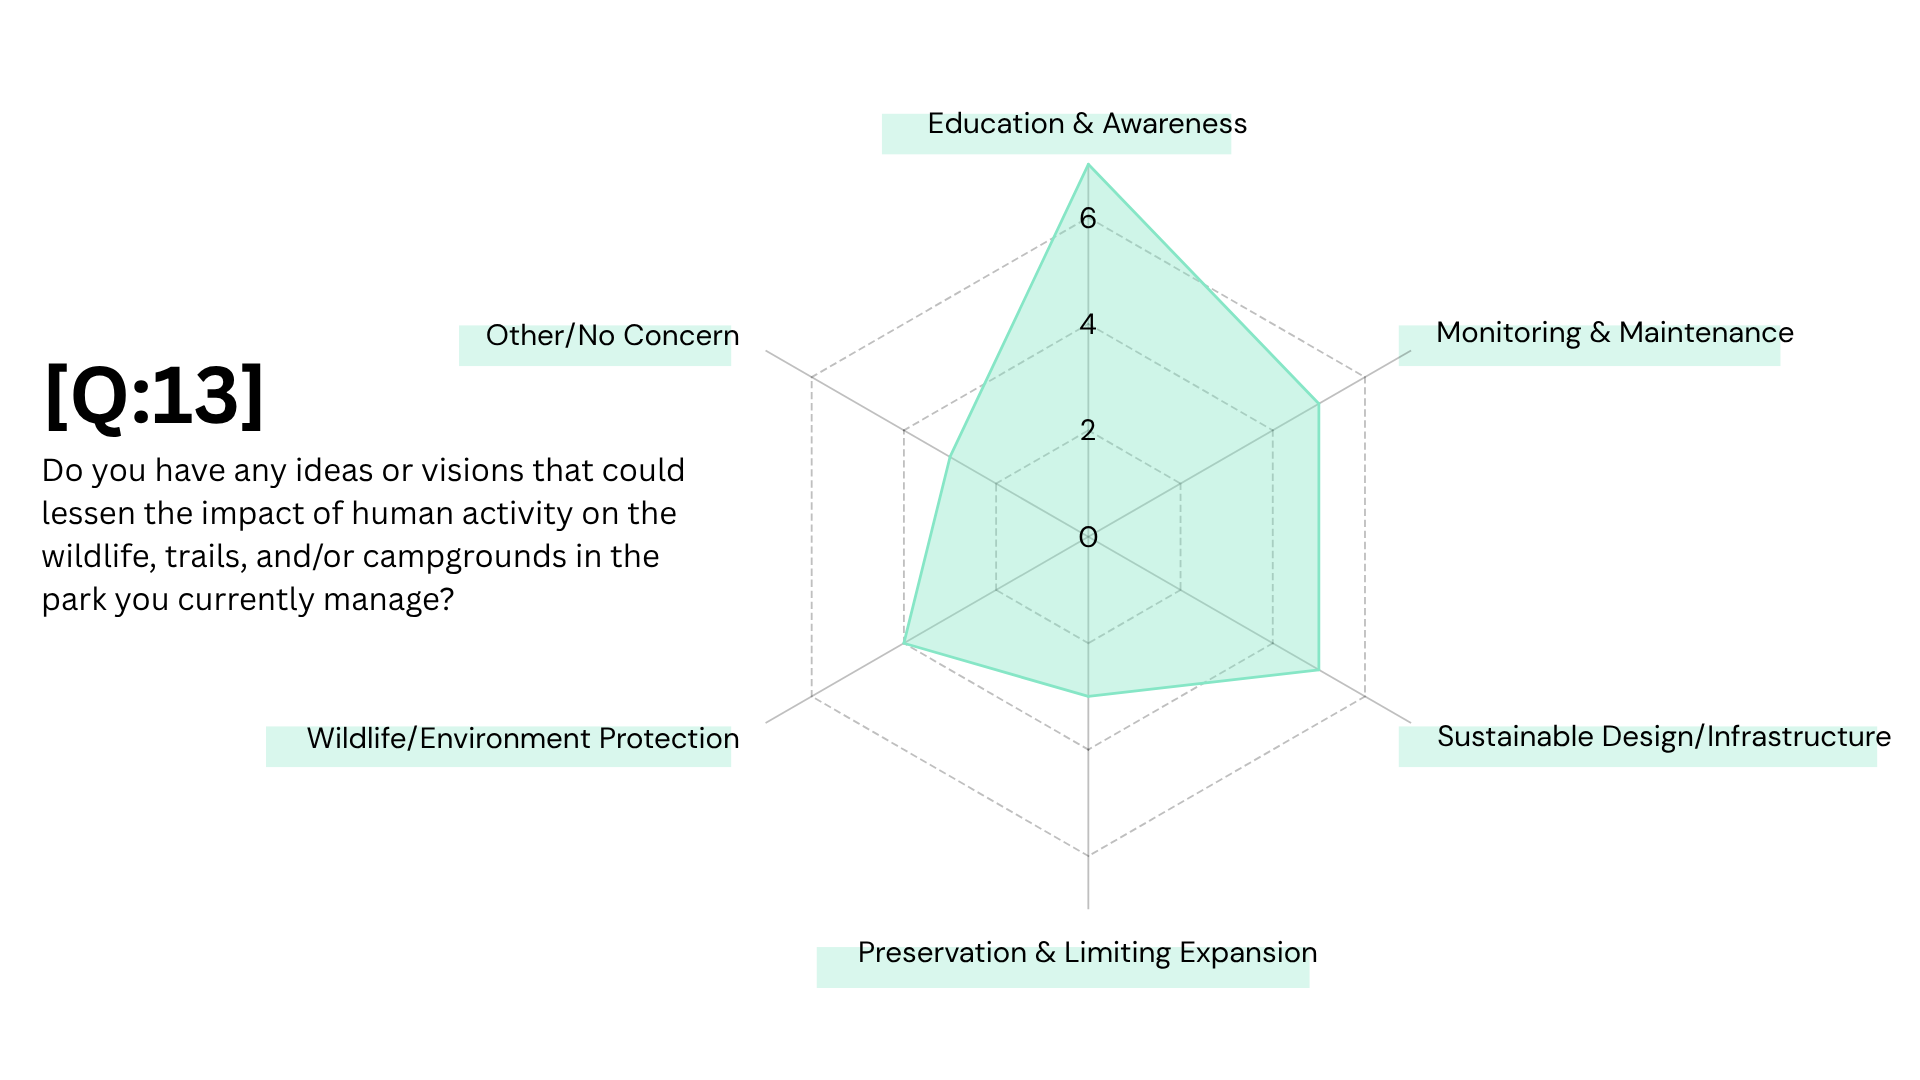
The same process was applied to analyze data collected from Question 13, which gave our respondents a chance to share any visions they had for future conservation strategies, suggestions to improve what is already in place, or any ideas that might help lessen the impact of outdoor recreation on the environment.