DarkSky Ohio Volunteers: Observations of Light Pollution and Public Opinion
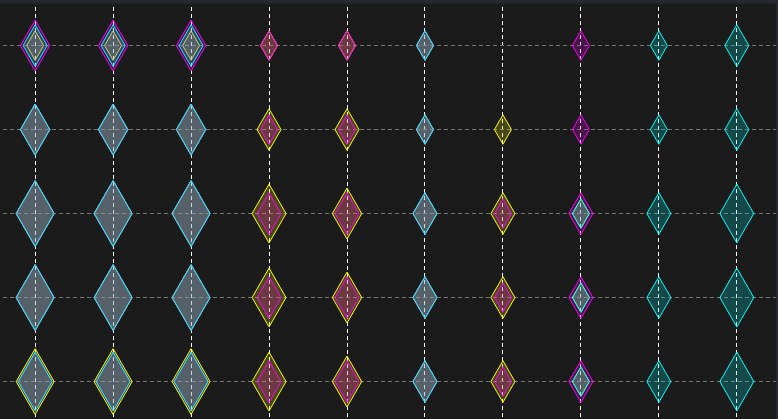
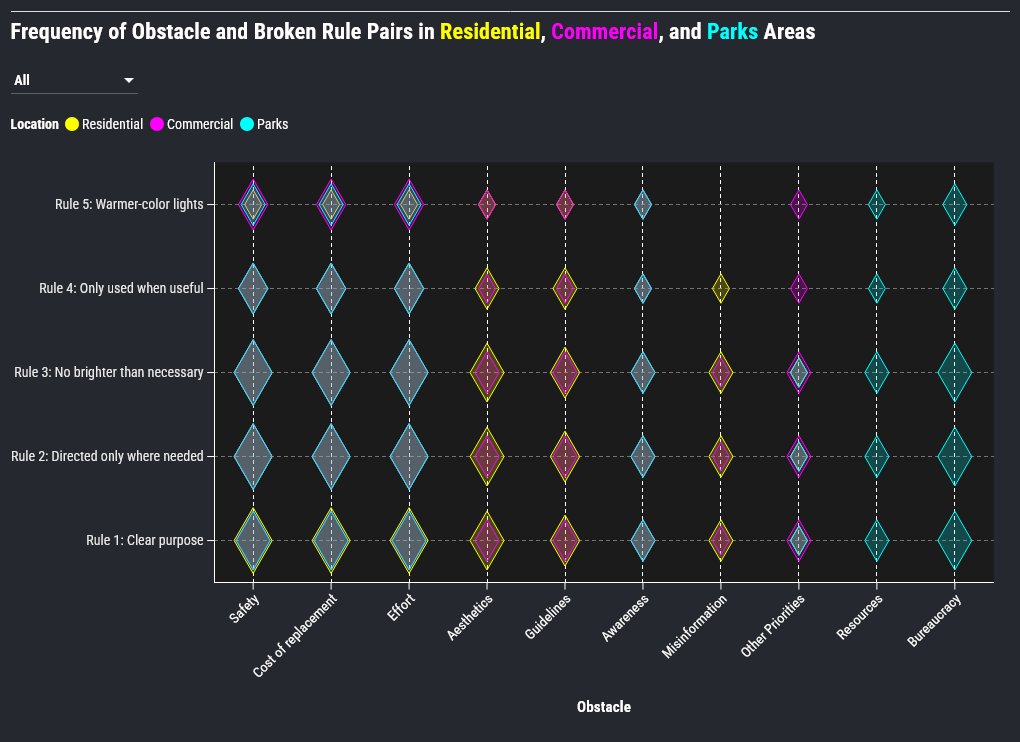
Main Data Visualization
Complimentary Visualizations
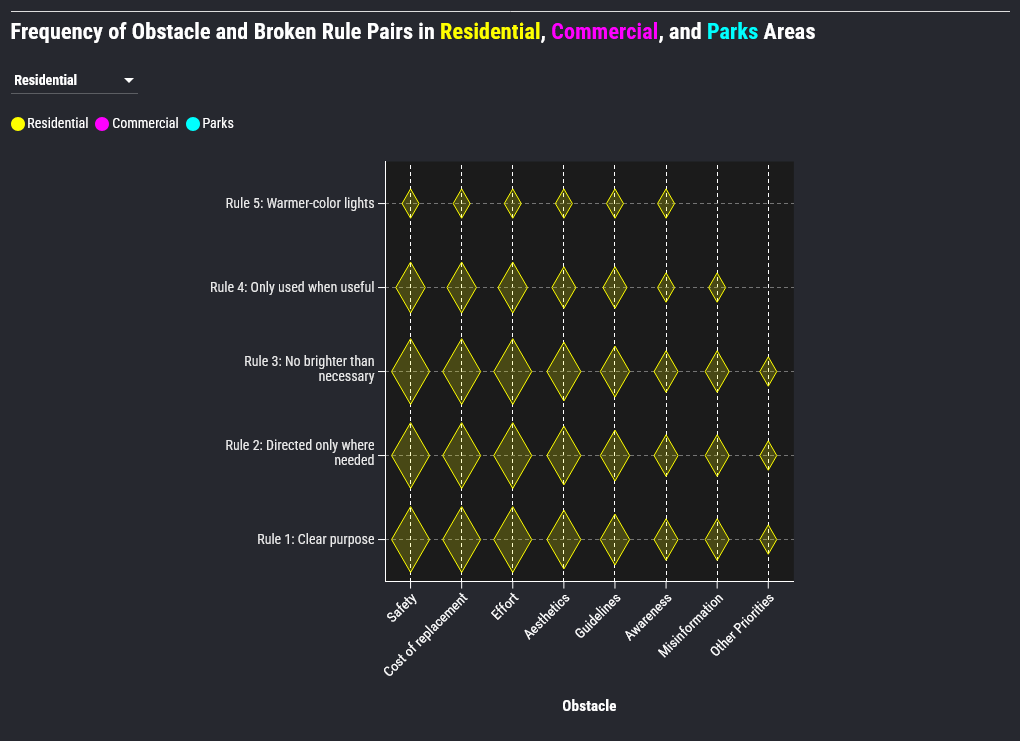
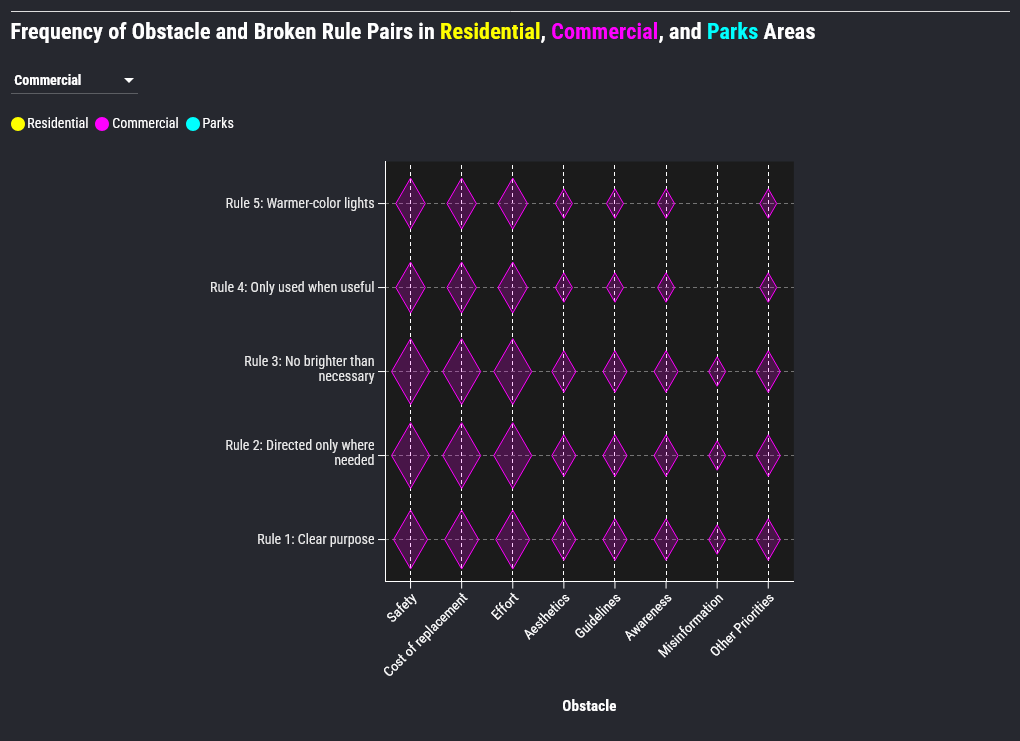
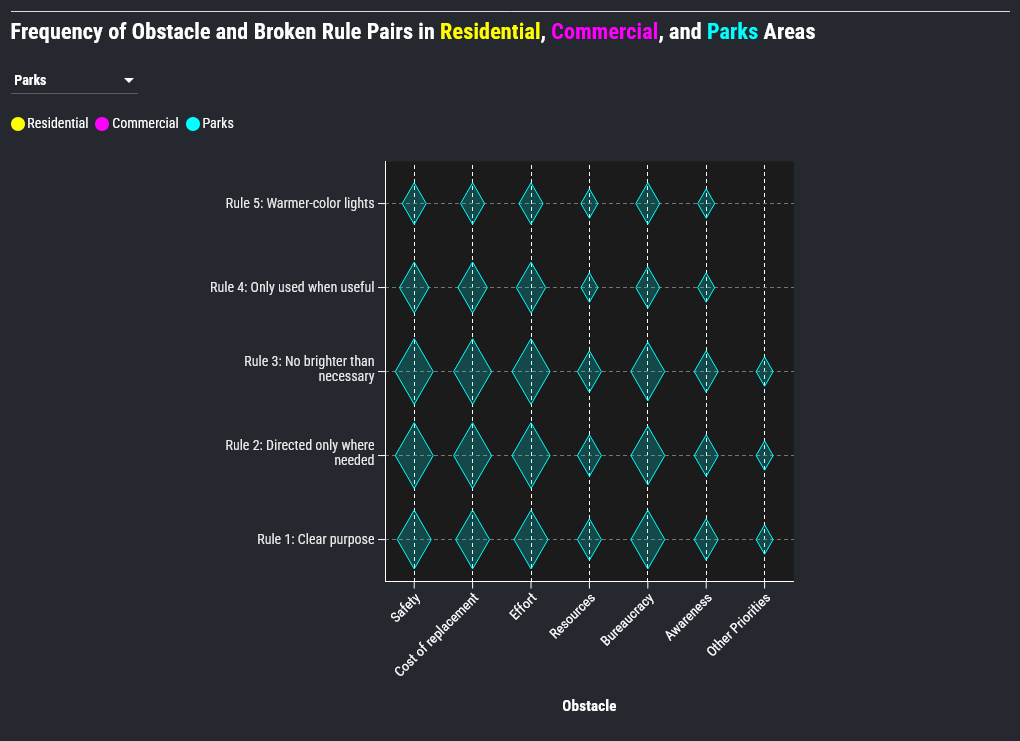
Represents 11 responses to 6 questions specific to each location (Residential, Commercial, and Parks)
Data Visualizations Explained
Who
This graph visualizes the responses of 11 DarkSky Ohio volunteers to 6 questions.
X-axis: Obstacles
The obstacles outlined were based on interviews I conducted with experts and options added by participants in the fill-in-the-blank "other" category.
- Choose the top 3 most common obstacles in residential areas that you think prevent people from switching to responsible lighting practices.
- Choose the top 3 most common obstacles in commercial areas that you think prevent people from switching to responsible lighting practices.
- Choose the top 3 most common obstacles in parks areas that you think prevent people from switching to responsible lighting practices.
Y-axis: Rules
The 5 rules listed are the 5 Rules for Responsible Lighting Practices outlined by DarkSky International in their standardization materials.
- Choose the top 3 of the 5 principles for Responsible Outdoor Lighting that are most often broken in residential areas.
- Choose the top 3 of the 5 principles for Responsible Outdoor Lighting that are most often broken in commercial areas.
- Choose the top 3 of the 5 principles for Responsible Outdoor Lighting that are most often broken in park areas.
Points
Each coordinate represents the instance where an individual participant selects that obstacle and that broken rule for the same location.
Diamond Color
The color of the diamond represents which location the pair is connected to
Diamond Size
The size of the diamond represents the number of participants that had the same obstacle and broken rule pair. There are 5 diamond sizes representing 1 participant to 5 participants.
Flourish, a data visualization platform, created all visuals with data I collected and analyzed.