Survey: KCC Community
Sampling Strategy
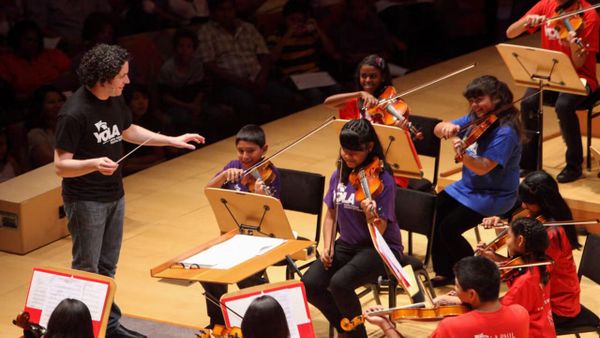
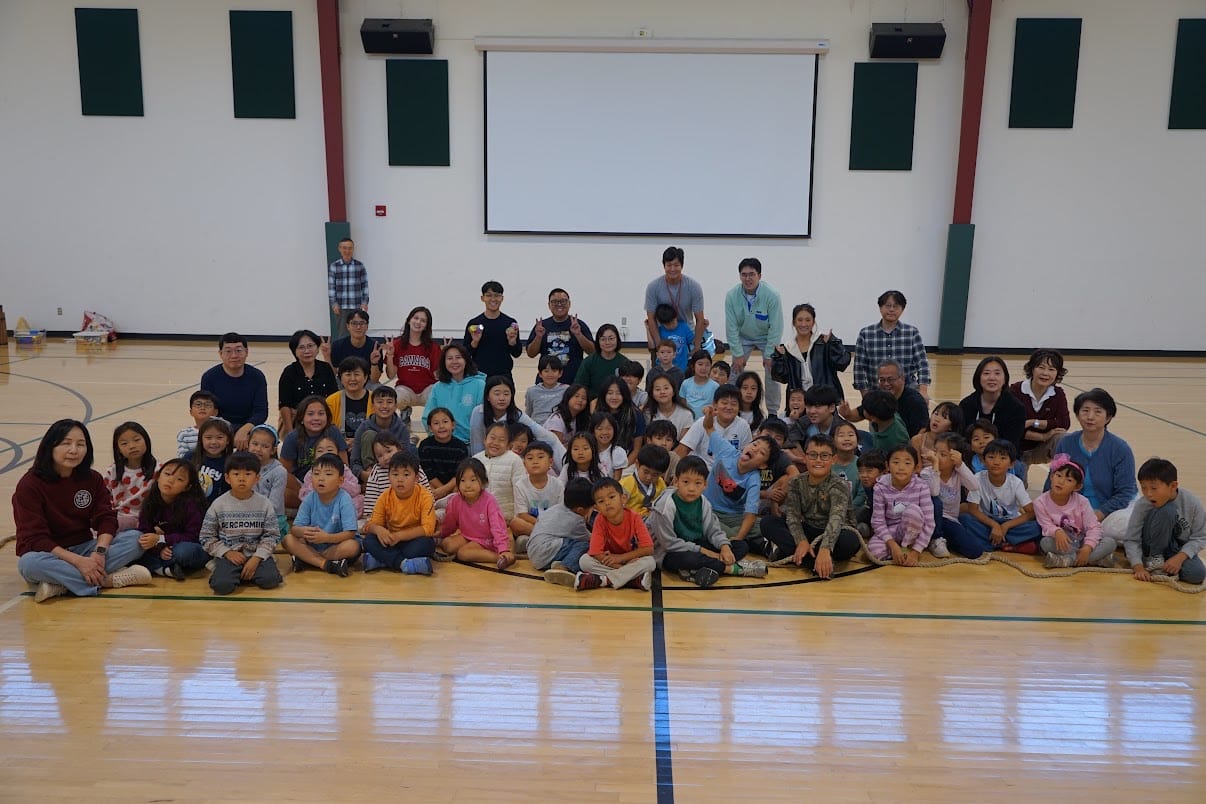
Specifically focusing on families with children, I recruited participants from the KCC Korean School community, where I also teach. The school’s group chat has 67 members, including parents and teachers. The survey was shared through the existing group chat, and 12 participants (18%) completed the survey. The survey goal was to understand how family relationships look like and how they interact with one another during car rides.
Survey Structure
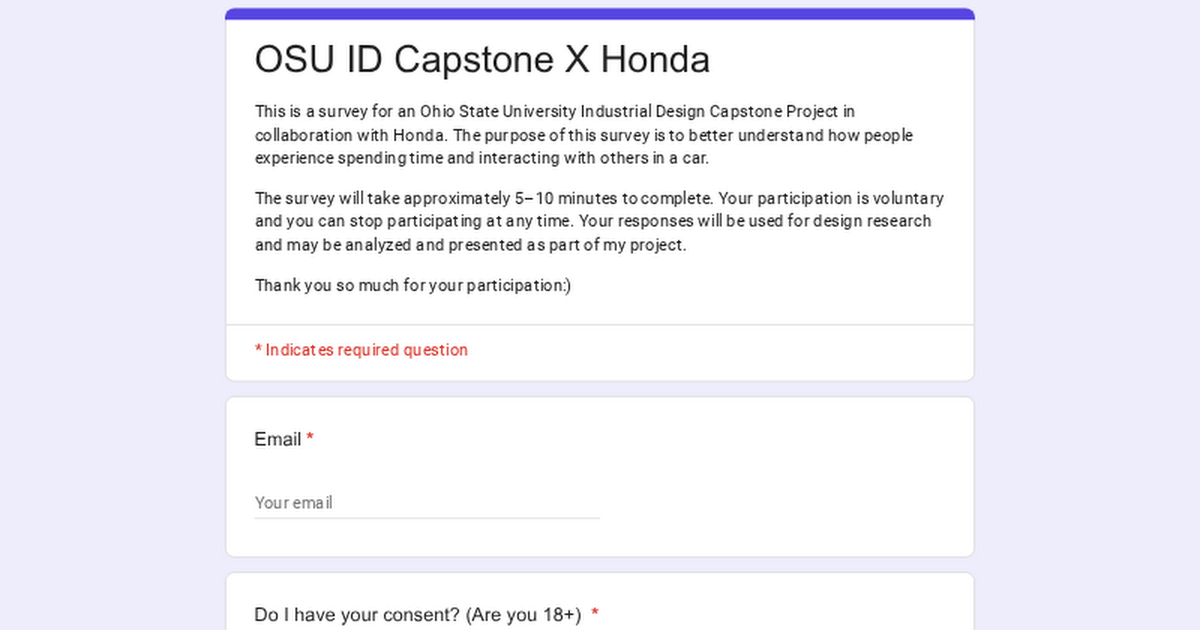
The survey asked who, what, how, and when. Participants answered questions about who they live with, how many children they have, and the ages of their children. They then described who they most often ride with, why they take car trips together, and what they usually do during those rides. The survey also asked how often they talk, share memories, play games, listen to music, use phones, and enjoy the scenery. Finally, participants were asked how long it usually takes to have a meaningful conversation and to describe a memorable car experience.


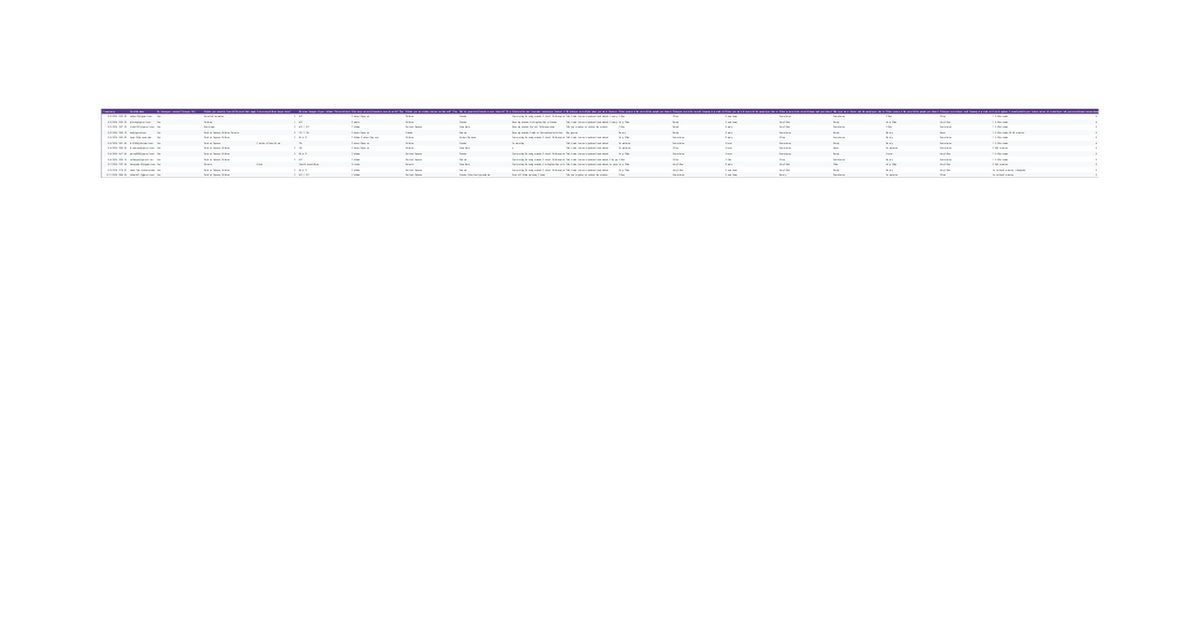
Result
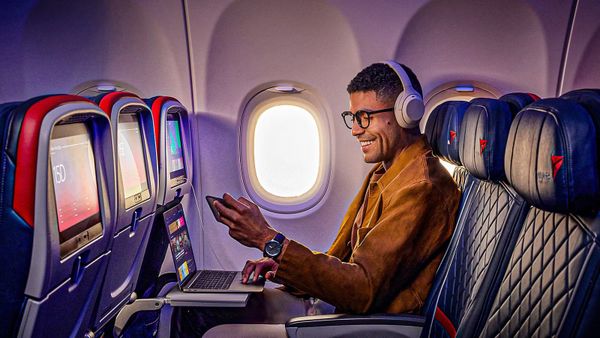
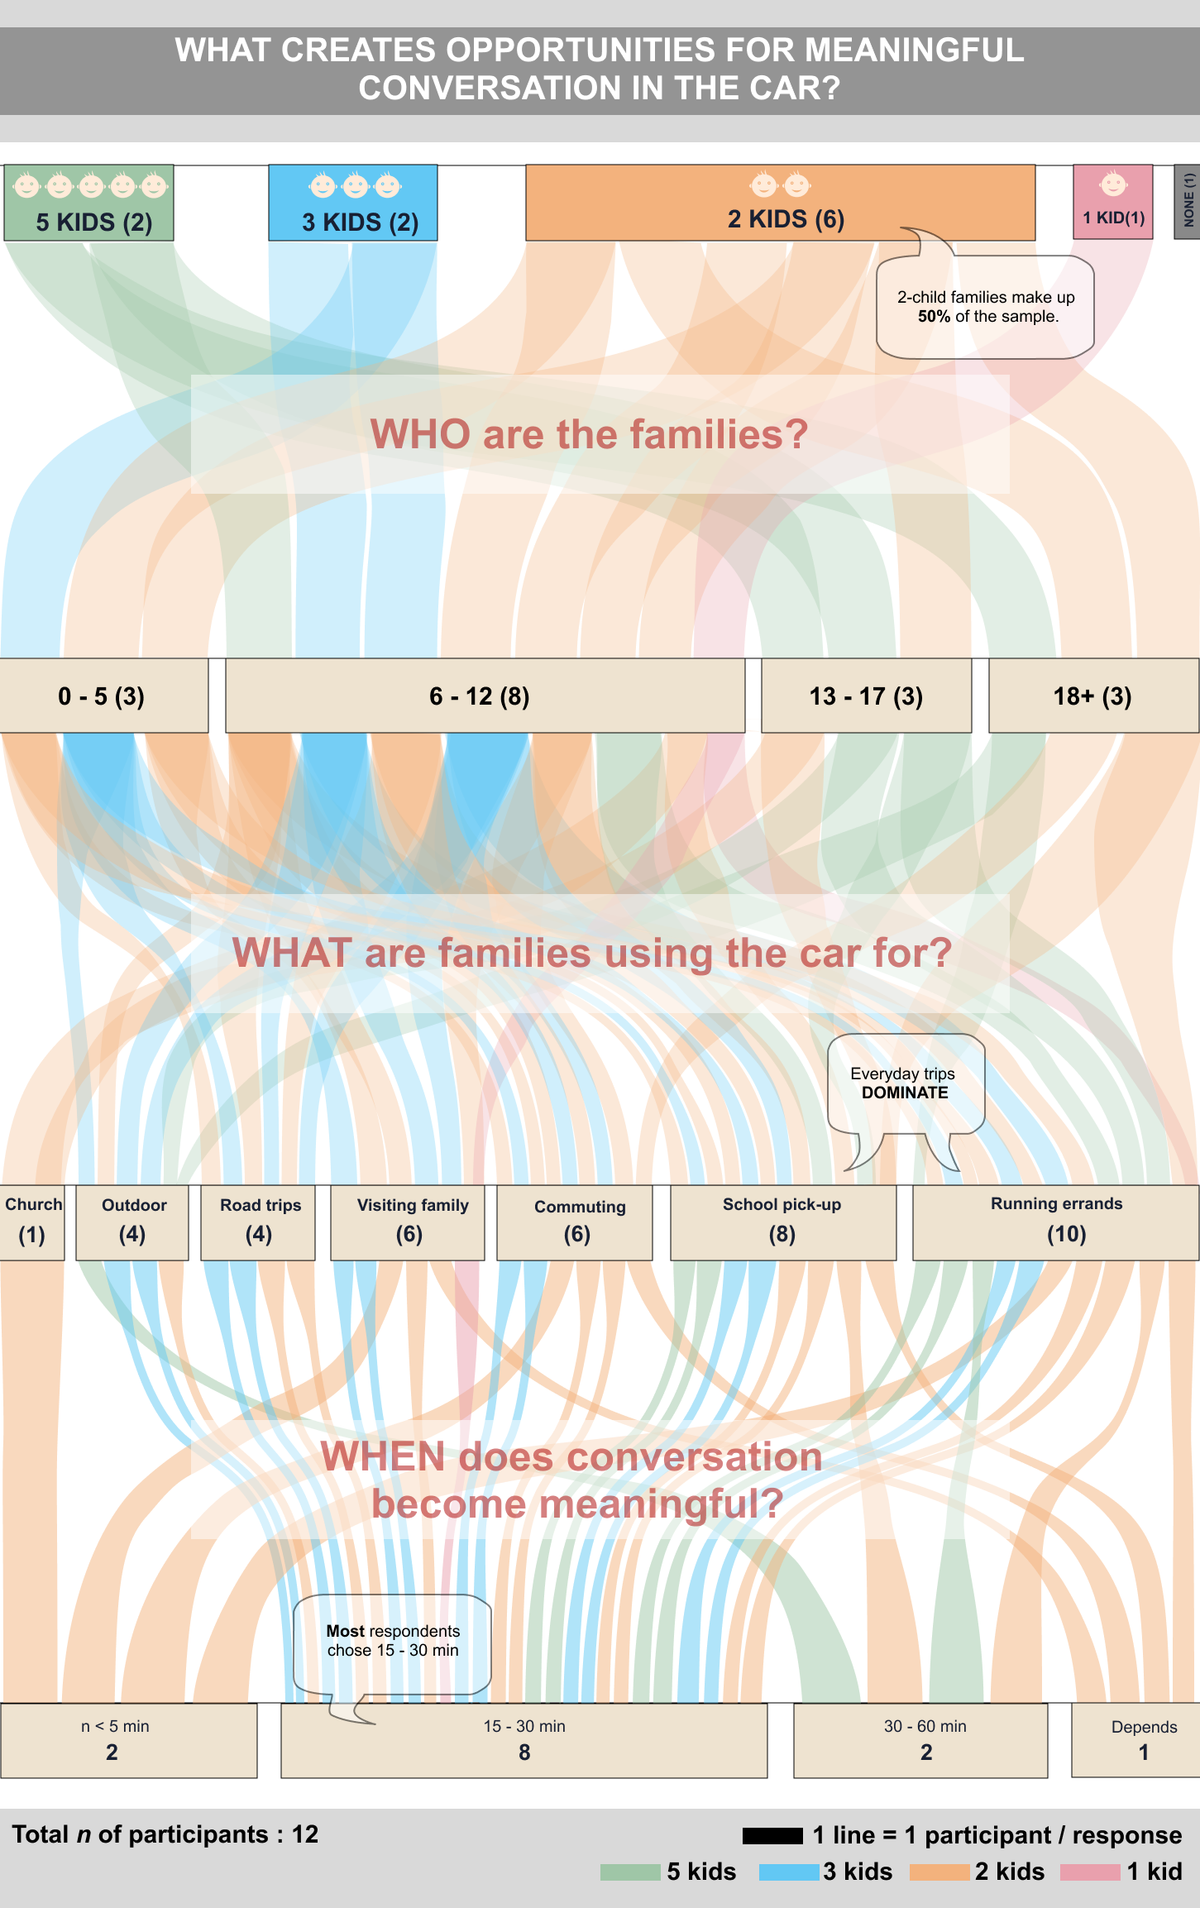
The results showed that car rides are closely connected to everyday routines. Talking and listening to music were also common activities. 15–30 minutes was the most frequently selected timeframe for meaningful conversation.
Visualization
I visualized each participant as a connected line using Parallel sets diagram. The visualization connects four main questions I took from the survey.