Survey Analysis
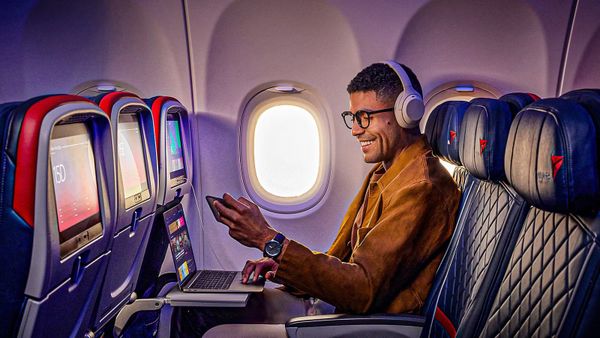
This survey was sent to Saudi students studying at The Ohio State University who are parents. for my survey I wanted to understand how families spend their time during car rides, how children use screens and what activities create interaction between family members. The survey contained 13 questions about screen use, conversation, shared activities and how the outside environment affects the car ride. I also included questions about what parents would also like to see more of during family rides.
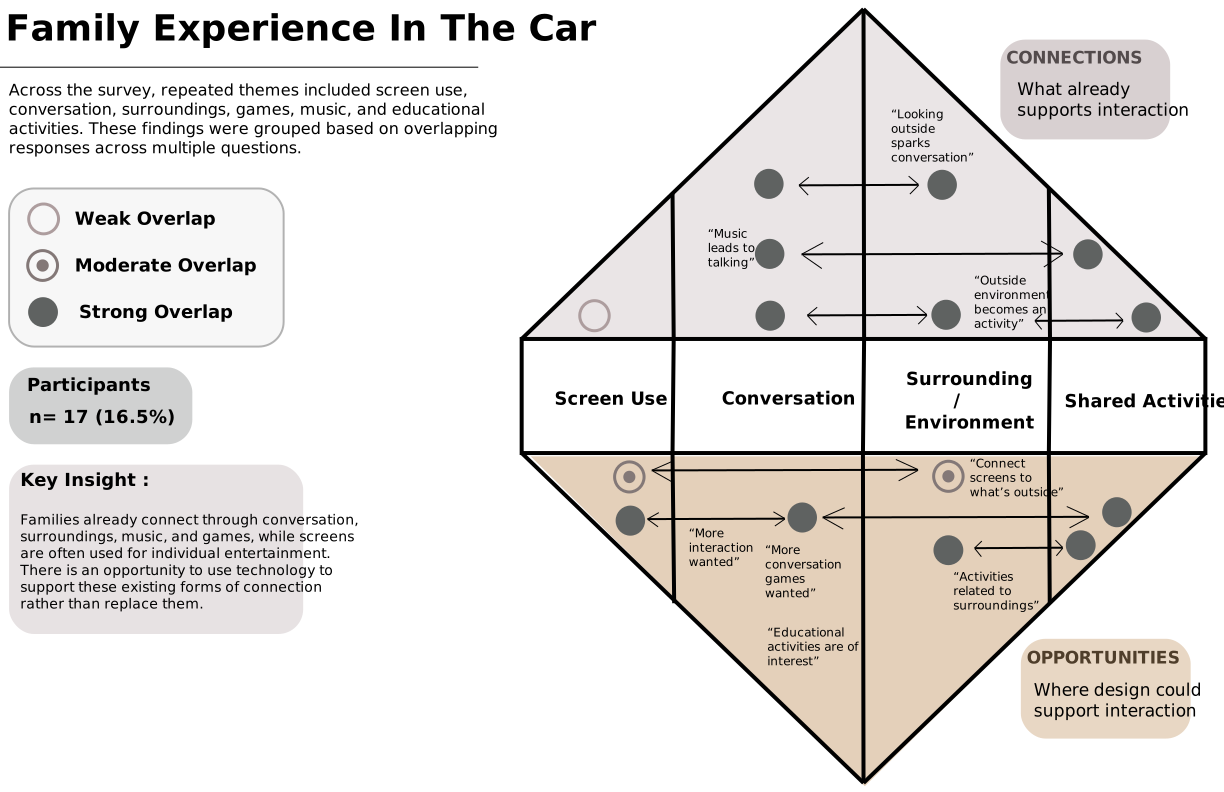
I received 17 responses out of a 103, which was 16.5% response rate. after looking through the responses, I noticed that many answers were connected even though they came from different questions. instead of showing every survey question separately, I grouped repeated responses into four main themes: screen use, conversation, surroundings/environment, and shared activities. The strength of each relationship was based on how often similar ideas appeared across participants' responses.
For the Visualization, I wanted to show the relationship between these themes and how strongly they overlap. The top section shows connection that already support family interaction, while the bottom shows opportunities where design could support more interaction. I also included short qualitative responses from participants to show where the relationships came from. Overall, the visualization helped me see that conversation, surroundings, shared activities already create connection, while technology could support these interaction.
Survey Link: https://docs.google.com/forms/d/e/1FAIpQLSc2jhKOe5-uiPPmoLqASS9aBxTP3yoJipR2teAQ3yVWocFTbw/viewform?usp=header
Reference
Grammarly. (n.d.). https://app.grammarly.com/